The below example guides you through how to plot your CPU temp as a graph to an image file, the code is in my github repository where I’ll hopefully add further functionality in the future.
How to guide
First off you need to install Python3
sudo apt-get install python3
sudo apt-get install python-setuptools
sudo apt-get install python3-pip
Next install GNUPlot
sudo apt-get install gnuplot-x11
Then we need to setup a working directory:
cd ~
mkdir plottemp
cd plottemp
create the necessary files:
nano datagen.py
Paste in the following code:
#!/usr/bin/env python

import sys, os, logging, urllib, datetime

def fetchtemp():
	cmd = '/opt/vc/bin/vcgencmd measure_temp'
	line = os.popen(cmd).readline().strip()
	output = line.split('=')[1].split("'")[0]#+' C'
	return output

format = "%Y-%m-%d,%H:%M:%S"
today = datetime.datetime.today()
s = today.strftime(format)
output = s+' '+fetchtemp()+'\n'

print(output)

with open('/home/pi/plottemp/tempdata.dat', 'a') as f:
	f.write(output)
Create this also
nano plottemp.sh
and paste the following:
#!/bin/bash
echo "set terminal png size 900, 300
set xdata time
set xrange [ time(0) - 86400 : time(0) ]    # 86400 sec = 1 day
set timefmt '%Y-%m-%d,%H:%M:%S'
set format x '%H:%M'
set output '/home/pi/plottemp/tempplot.png'
plot '/home/pi/plottemp/tempdata.dat' using 1:2 with lines" | gnuplot
make it executable
chmod +x plottemp.sh
next all we have to do is to run the script every 5 minutes (or whatever interval you choose) with cron:
crontab -e
and add this line:
*/5 * * * * python3 /home/pi/plottemp/datagen.py && /home/pi/plottemp/plottemp.sh &> /dev/null
and there we have it, it will generate a file called:
plottemp.png
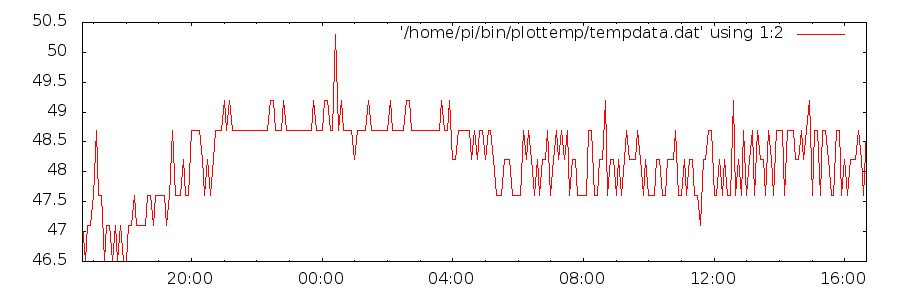
The result
If you have successfully implemented the instructions you should get something like this:
How it works
I’ll very briefly walk you through how it works – there’s a cron job running every five minutes which firstly runs a command line function which reports the CPU temp and saves it to a log file. Upon completion it then runs a GNUPlot command to generate a graph of the last 24 hours logging.
Download
Install from GitHub: